Understanding share-of-savings fees and total administrative costs

Over the past decade, billed charges and share-of-savings contract provisions have increased rapidly, driving up the total costs of health care for employers. Officially, share-of-savings expenses are variable administrative fees often applied from a portion of discounts captured through a supplemental network and/or negotiations with other non-contracted providers.
Coordination of Benefits (COB) recovery example: Where does the money go?
A lower administrative fee doesn't always mean lower administrative costs. Consider this example:
Vendor recovery:
- Administrator pays: $1,000
- COB reimbursement: $1,000
- Administrator keeps 30 percent share of savings: -$300
- Amount returned to you: $700
Employers pay a base fee per employee, per month (PEPM) before this percentage of savings is calculated. Depending on contract terms, the percent of savings shared back with the administrator can differ per service.
If an administrator does not have share-of-savings contract provisions, you would get the full $1,000 returned to you in this example.
Many businesses are unaware of the extent these contracts and administrative fees have on total costs — partly because share-of-savings arrangements are designed to make fixed administrative fees appear more competitive — and they don’t always appear in requests for proposals.
Some administrators capture a whopping 30–50 percent share-of-savings fee on non-contracted providers. But the full amount is frequently unknown or highlighted — and often goes unnoticed unless it’s caught deep within a standardized bank draft.
This, along with other contract provisions, allow additional share-of-savings fees that can add another $8–$14 per employee per month (PEPM), like in the following example.
Administrator A vs. Administrator B: Which offers better long-term value?
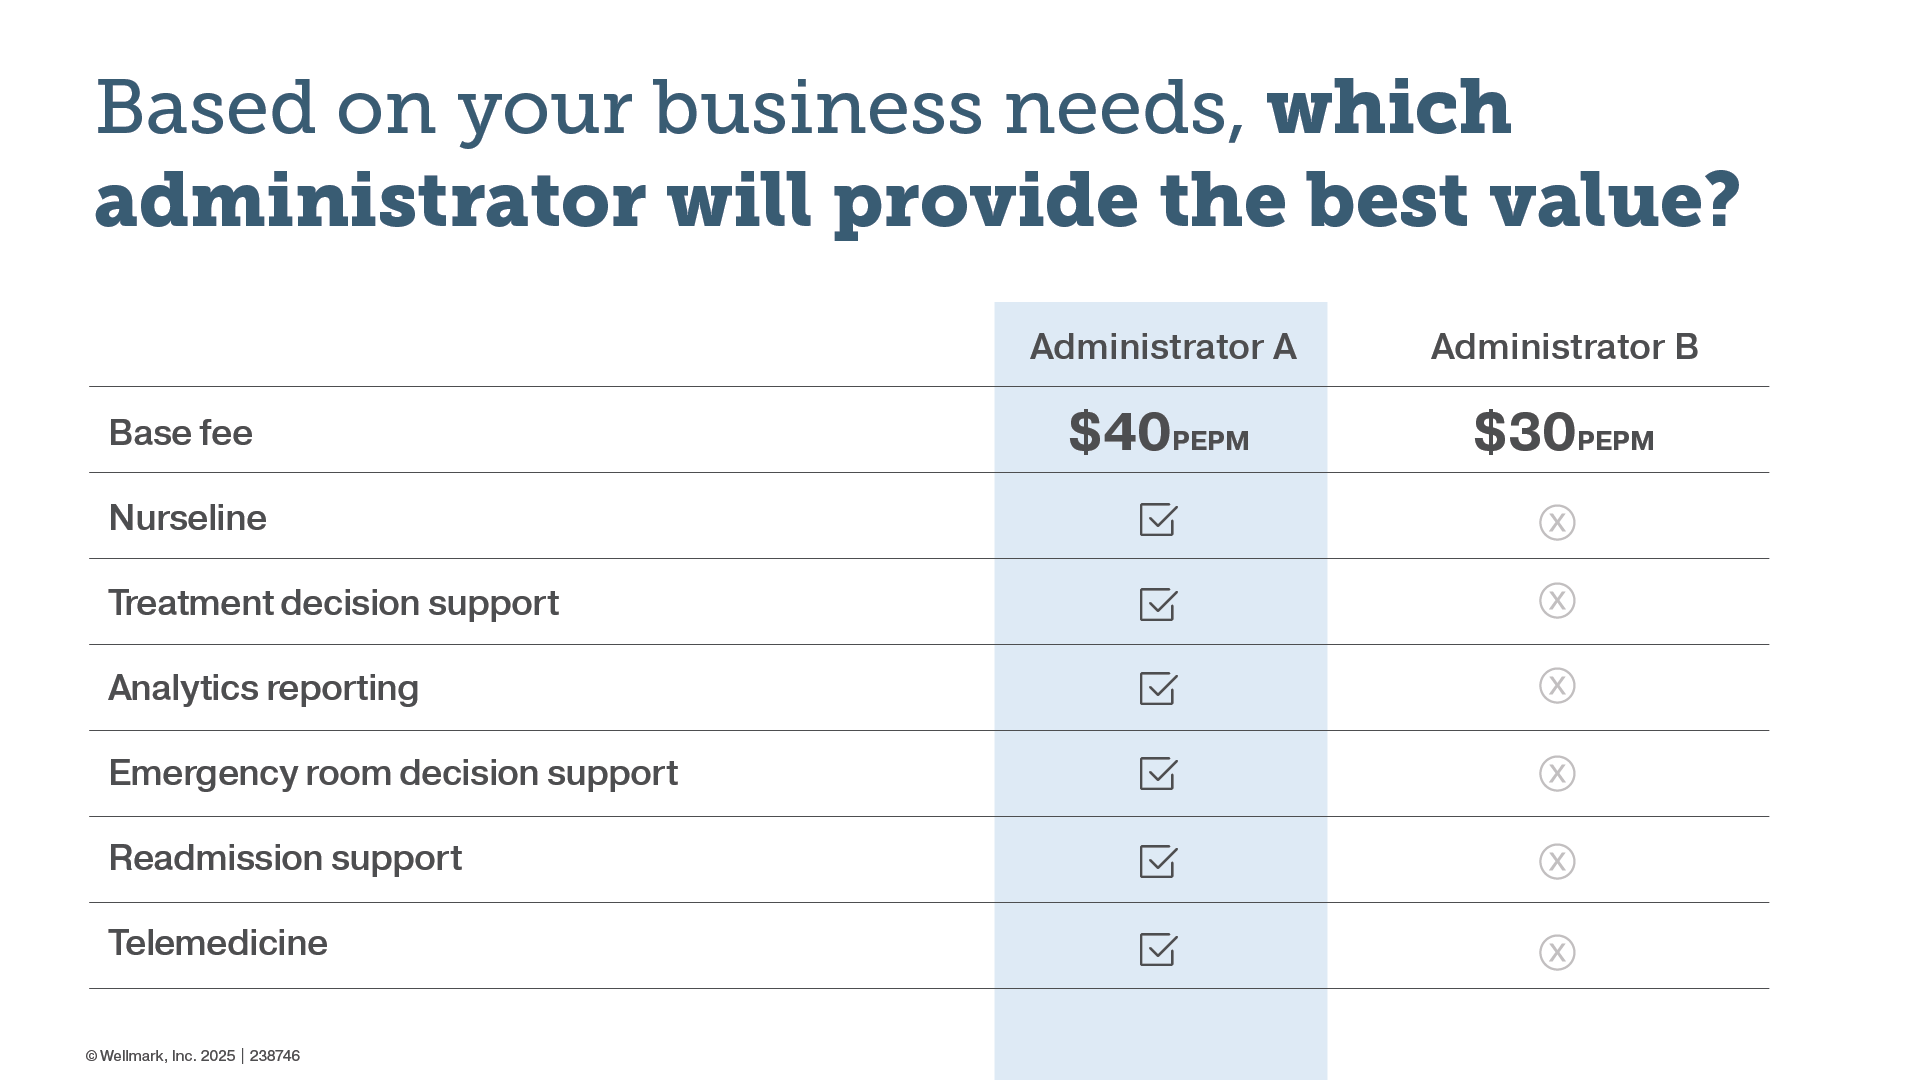
An infographic titled “Based on your business needs, which administrator will provide the best value?” compares Administrator A and Administrator B across cost and service offerings.
The table lists a series of health plan support services and indicates whether each administrator provides them. Administrator A is highlighted in a light blue column and has check marks for all listed services, while Administrator B displays X symbols indicating those services are not included.
Comparison details:
- Base fee
- Administrator A: $40 PEPM (per employee per month)
- Administrator B: $30 PEPM
- Nurseline
- Administrator A: Included
- Administrator B: Not included
- Treatment decision support
- Administrator A: Included
- Administrator B: Not included
- Analytics reporting
- Administrator A: Included
- Administrator B: Not included
- Emergency room decision support
- Administrator A: Included
- Administrator B: Not included
- Readmission support
- Administrator A: Included
- Administrator B: Not included
- Telemedicine
- Administrator A: Included
- Administrator B: Not included
The graphic uses dark blue headings, gray text, and a clean table layout on a white background. The design emphasizes that although Administrator A has a higher monthly fee, it includes a broader set of employee support services.
Administrator A: Higher base fee, more services included
$40 PEPM included in the base fee:
- Cost reduction and savings program, large bill review/fee negotiation and secondary/travel network: Yes
- Credit balance recoveries: Yes
- Supplemental network savings: Yes
- Hospital bill review: Yes
- Hospital/professional bill audit: Yes
- DRG validations and appeals: Yes
- Inpatient admission retrospective review: Yes
- Provider credit balance recovery: Yes
- Eligibility over-payment recovery: Yes
- Fraud and abuse management: Yes
- Facility reasonable and customary bill management: Yes
- Facility fee negotiation: Yes
Administrator B: Lower PEPM fee, higher share-of-savings charges
$30 PEPM included in the base fee:
- Cost reduction and savings program, large bill review/fee negotiation and secondary/travel network: No, 30% share of savings
- Credit balance recoveries: No, 20% of recovery
- Supplemental network savings: No, 40% share of savings
- Hospital bill review: No, 31% of recovery
- DRG validations and appeals: No, 30% of recovery
- Inpatient admission retrospective review: No, 30% of recovery
- Provider credit balance recovery: No, 30% of recovery
- Eligibility over-payment recovery: No, 29% of recovery
- Fraud and abuse management: No, 33% of recovery
- Facility reasonable and customary bill management: No, 40% of savings
- Facility fee negotiation: No, 35% of savings
In the example above, Administrator B has a much lower base fee. However, they also retain a large percentage of share-of-savings and recoveries. Those charges are included in the base charge for Administrator B. This could lead to Administrator A having the better value at the end of the day.
Looking beyond base administrative fees when comparing administrators
As an administrator, you’re constantly looking at ways to control costs while still providing your employer and employees all of the services they need. By asking the right questions when comparing administrators, you can measure the total administrative cost that includes explicit fees and share-of-savings expenses.
The bottom line? Make sure you are digging deep into the fine print to know your true total administrative costs and don’t take the base administrative service fees at face value when comparing administrators.
Disclaimer
This article is primarily intended for self-funded, large groups in Iowa and South Dakota.